
Prior to Flatiron, my main experience with logs was limited to scanning the output of tail -f on a flat file during a deploy or the occasional frantic search for strings like "error" when a system malfunctioned. I was excited when I discovered Silver Searcher, and started replacing grep with ag. I find this somewhat comical in retrospect. While manually digging through logs from the command line can be an effective tactic for tasks like application debugging, it is not best suited for more complex use cases.Prior to Flatiron, my main experience with logs was limited to scanning the output of tail -f on a flat file during a deploy or the occasional frantic search for strings like "error" when a system malfunctioned. I was excited when I discovered Silver Searcher, and started replacing grep with ag. I find this somewhat comical in retrospect. While manually digging through logs from the command line can be an effective tactic for tasks like application debugging, it is not best suited for more complex use cases.
Several months ago, Flatiron adopted Splunk for our logging infrastructure. After a few minutes of poking around in the application's UI, I found my [admittedly limited] bash skills were no match for this powerful tool. Splunk is much more than an aggregator with efficient searching; it's full of built-in tools for statistics, visualizations, alerting, and more. There are hundreds of third-party add-on applications available through Splunkbase.
Let's focus on a simple use case that requires only Splunk's native functionality - using DNS logging to detect malicious activity. DNS logs are an eye into interactions with the public internet and thus a natural starting point for some quick analytics. Apart from detection of potentially malicious domains, or correlation against DNS blacklists, monitoring DNS traffic is also valuable for detection of certain forms of data exfiltration as well as some forms of malware command and control.
(The following example assumes DNS log collection has already been setup. Splunk offers multiple options for picking up logs - use the one that best suits your system.)
For purposes of this exercise, let's limit verbosity and assume a simple json format for our DNS logs:
{
 "machine": "12.345.6.78",
 "dns_indicator": "foo.bar.com",
 "another_field": "another_value"
 }
In an ideal world, our logs would be this trivially parseable. In reality at Flatiron, we use a quick regex to pull relevant activity out of our slightly noisier inputs.
We begin with an easy but informative question - what are our highest traffic indicators? We can leverage Splunk's query language for aggregate counts:
index=system host="host.flatiron.com" source="/var/log/dnslog"| stats count by dns_indicator| sort -count
Note that an index, host, and source, though not strictly required, are included as an optimization leveraging Splunk's index-time extraction. We can also specify a time range - preset or custom. Our results consist of a neat table:
dns_indicator count
foo.bar.com 4
baz.qux.edu 3
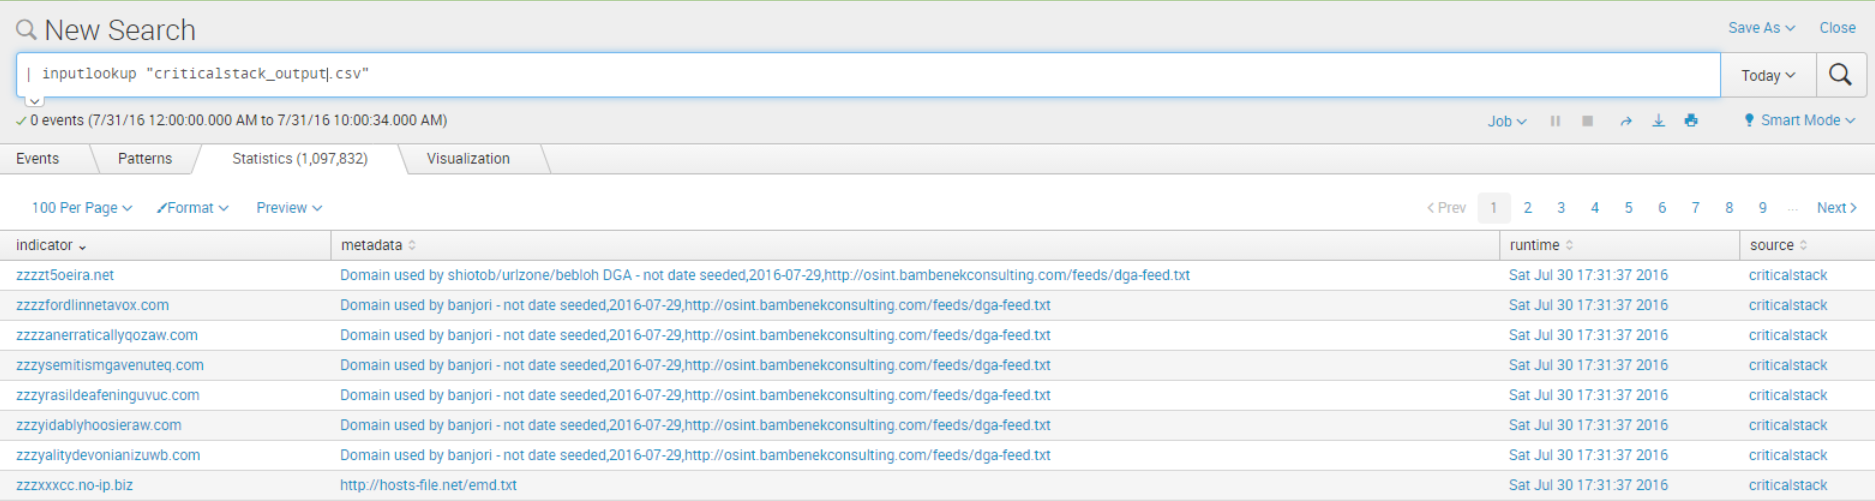
Now that we have a basic grasp on our DNS logs and how to wrangle them in Splunk, let's try to find some potentially malicious activity on our network. "Malicious activity" is, admittedly, a loaded phrase with a wide breadth of meaning. Rather than define every type ourselves, let's explore threat intelligence-based indicators where we outsource to experts - in this case, Critical Stack - who provide us with updated malicious indicators. We set up a nightly script that pulls malicious indicators from Critical Stack's free API and dumps them into a neat, readable csv file. The file quickly becomes available via the Splunk UI with the simple query
| inputlookup "criticalstack_output.csv"
Now, we're ready to look for intersections between our malicious domain list and DNS logs. We call Splunk's native lookup function and filter out null metadata to get an inner join.
index=system host="host.flatiron.com" source="/var/log/dnslog"
 | lookup "criticalstack_output.csv" indicator OUTPUT metadata
 | where not isnull(metadata)
 | stats count by indicator
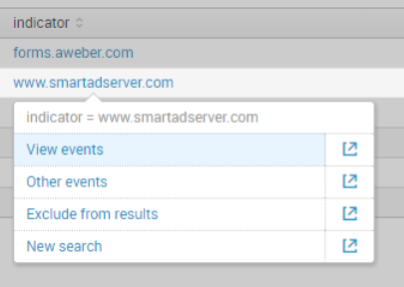
Voila! A list of malicious indicators by count. If we want to drill down to figure out from which machine a given request originated, it's only a matter of clicking in to drill down into raw events.
Now, we are free to set custom alerts based on detected activity and build dashboards to visualize our new dataset.
The outlined approach with Critical Stack is admittedly primitive and will likely result in false positives. Consider building more complex queries to reduce noise for your specific use case. Keep in mind that proper implementation, as with other aspects of engineering is an iterative process. Luckily, Splunk is a powerful and extensive tool to help with your exploration.
Happy Splunking!