Sometimes, things have a way of coming into your life at the moment you most need them.
Every year, our entire company of almost 500 gathers at a venue in New York City to hear updates from teams across the company, get additional insight into our strategy from our co-founders, and spend time with colleagues based in other offices and cities.
A biostatistician by training, I work on our Quantitative Sciences team analyzing oncology data collected in real-world settings. My job is to use statistics to learn from the experience of every patient with cancer—not just the small percentage enrolled in traditional clinical trials. I was asked to present on my team's research during this "All-Hands" meeting—an exciting honor when I agreed to it months earlier, but as the date approached, my excitement started to be eclipsed by nervousness. I give a lot of talks, but this one was different. The All-Hands was going to have a larger audience than I had ever presented to, and it was going to be in front of my colleagues; people who I see everyday and whose opinions I care deeply about. Also, I was used to presenting scientific results to scientists. What I was not used to was presenting scientific findings to my colleagues and peers, most of whom are not scientists.
I thought of the people who would be in the audience.
Rosie, the always-optimistic manager of our office team who helps make our New York City office warm and welcoming every single day
Neal, the research oncologist from Cleveland who recently joined the company after 30 years in traditional academic medical center and university environments
Ben, head of our Provider Sales team, who has spent years understanding the software challenges that community oncology practices face
Lise, a certified public accountant who left a promising career in the financial services industry to join Flatiron when we were still a small startup finding our way
The week before our All-Hands meeting, with the presentation still looming over me, I blocked it out of my mind because I had to focus on a more immediate task and talk at hand: presenting statistical details of validating oncology endpoints at the International Conference on Health Policy Statistics. Scientific findings to a scientific audience.
At the tail end of the last day of the conference, the suitcases in the meeting rooms and the limited attention spans signalled everyone's eagerness to get home. I, too, was eager to head back to New York City, but the winter weather had other plans. I saw in the program there was an unusual workshop in the last slot of the day hosted by the Alan Alda Center for Communicating Science that claimed to use improv theater techniques to help scientists communicate to a variety of audiences. Stuck in Charleston with nothing to do, I showed up -- skeptical yet intrigued. This was not the kind of thing that usually happened at a statistics conference. And what did all of this have to do with Alan Alda?
It turns out, Alan Alda hosted a television show on PBS called Scientific American Frontiers for many years, interviewing scientists about their research. Over time, he realized that his interview subjects tended to stay within their safe, technical bubbles, not venturing out to engage with the show's diverse audience. Scientists aren't trained in communications or presentation skills, but, through his center, he hoped to change this.
At the beginning of the workshop, the instructor handed out worksheets with Mad Libs-style exercises for us to ease into explaining our research in layman's terms. We filled in blanks:
This is important because people with cancer get sicker or get better, but no one learns from what worked or didn't work for most of them.
This is exciting because I get to work with a big and amazing source of information and, if I do my job well, can improve and maybe save peoples' lives.
We paired up and acted out scenes, explaining our research to our partner, who was instructed to react to our presentation as if they were an 11-year-old who wasn't familiar with technical scientific jargon. Equally as important as the language I used to describe the research, our instructor explained that the findings had to mean something to our partner in order to be understandable—we had to convey the "so what" of the work. So instead of focusing on the novelty and complexity of the statistical methods of my research, I took a different approach. "You might have a family member who gets sick one day, and you'll want their doctors to know about what happened to other patients like them." This meant something no matter who was on the listening side.
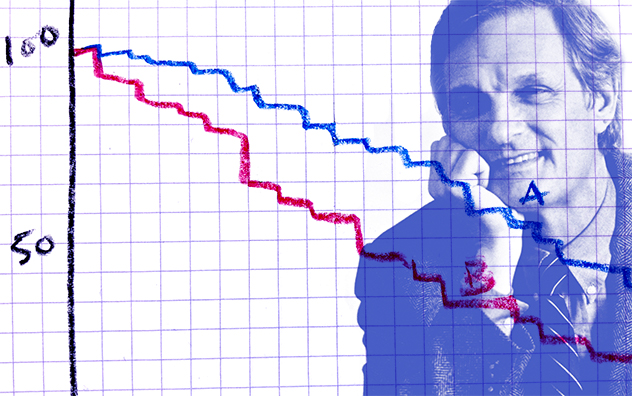
Now I was ready to present to a room of 11-year-olds, but I was still struggling with my All-Hands talk because of the diverse backgrounds and experiences of my colleagues who would be in the audience. Some knew a lot about the research I was planning to present. Kaplan-Meier curves, a staple of oncology research, show the percentage of population alive over a period of time, but can be complex to interpret. Was oversimplifying the results going to be difficult for Neal, our seasoned oncologist, to swallow? Would Lise, part of our finance team, get lost in the clinical details of the findings? And then, it hit me. I scribbled a single note on the back of my worksheet "What do they have in common?" Underneath, I wrote two words: "mission driven."
Despite all their differences, I realized everyone in the audience would have something in common. They were all driven toward a mission of improving the lives of people with cancer—family and friends they've known, or those they will know. For some, it might even be their past or future selves. The idea that those patients will get treatments, and might get sicker or better, but their experience likely won't ever help others. For all of these people, different in so many ways, that wasn't acceptable. That's what I'd speak to. I left Charleston with a worksheet, a hastily scribbled note, and newfound clarity.
The day of the presentation, I walked onto the stage, filled with nervous energy. I saw Ben Reynolds, head of our Provider Sales team, sitting in the front row, but far removed from the day-to-day context of the work I was about to present. Then something magical happened over the course of the presentation. The more data I showed, the more Ben's face lit up. After I saw that, I began presenting directly to him, feeding off his engagement and reaction. I couldn't see the other 500 faces in the darkened auditorium, but I knew that if it meant something to Ben, it had meaning for everyone.
That night at our company party, I heard from Rosie, our office manager. "Every day my team works hard to make sure everyone has what they need, we are always so focused on that. One day a year we get to take a step back and hear about all the amazing work Flatiron is doing, how it all comes together." She told me that the presentation brought tears to her eyes, and if this is what can come from her keeping the lights on, she feels honored to get to be a part of our mission.
I spend my days surrounded by data and figures. As a biostatistician, of course I live for this stuff. What I didn't know was whether it meant as much to everyone else. But then a winter storm and Alan Alda showed up in my life at exactly the right moment, and helped me see the link between my lines on a plot and the mission that connects us all.