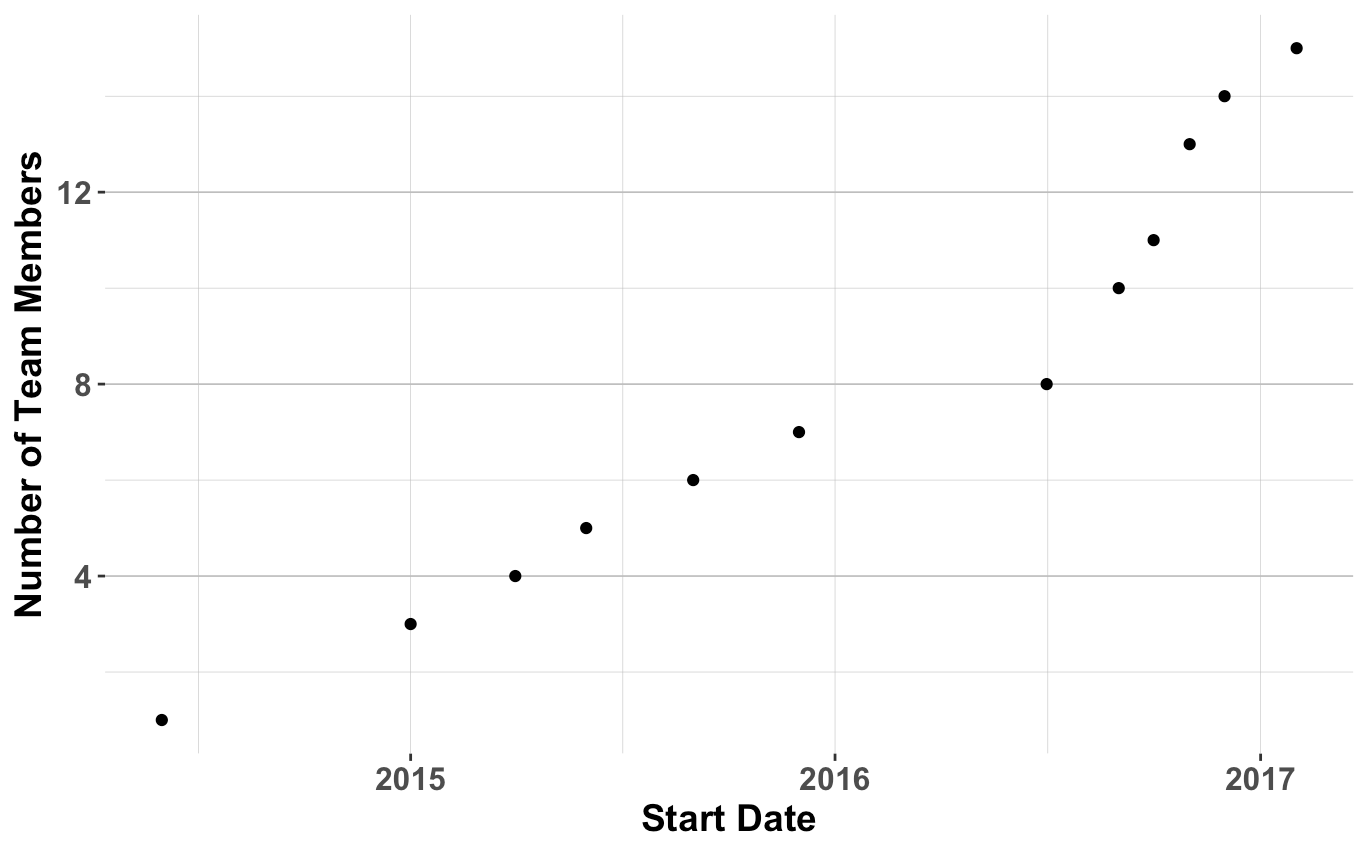
While the number of employees at Flatiron Health has more than doubled over a one year period, the growth of our Quantitative Sciences ("QS") team has been even more concentrated. At Flatiron Health, the QS team uses applied statistics, machine learning, and epidemiology to assess the quality of the data we produce, and provide insight into the characteristics of cancer patients and their journey through the healthcare system. We have a lot of exciting work to do, and over a seven month period, we grew from a team of seven to 15:

Figure 1: Growth of the Quantitative Sciences team through February 2017
When the initial team members were preparing for the recent growth spurt, we began brainstorming about how to efficiently onboard new team members. Since the QS team utilizes much of the engineering workflow, we attend most of the bootcamp sessions described in an earlier post. But, we have some specific needs around understanding our data that weren't addressed by the existing onboarding process. We also have the added complexity of onboarding new team members from different backgrounds ranging from cognitive science to healthcare economics. While we specifically look for diverse backgrounds on our team, this is a challenge for onboarding due to varying levels of expertise and experience in things like R (a statistical programming language), oncology and the nuances of electronic health data.
While the team was brainstorming onboarding ideas, a newer team member mentioned that she was continually told to "dig into the data," but she found it hard to assess whether she had dug in deep enough, or even into the right data. Then inspiration struck: since we consider ourselves to be "data detectives," new team members would probably enjoy a data scavenger hunt, and this could be a scalable and structured way to introduce new team members to Flatiron data.
In a manner compliant with HIPAA regulations, we work with several data sources, and it is especially critical to ramp up new hires on our two most heavily used resources:
-
-
Data derived directly from electronic health records
-
Processed health data which can be used for analysis
-
In designing the scavenger hunt, the original team members had several goals in mind for the new team members:
-
Build data intuition around our Flatiron data. The questions in the scavenger hunt give new employees a feel for the types of data questions that are important. Additionally, by answering the scavenger hunt questions, they are able to start to get a feel for values of different metrics such as survival rates for different cancers.
-
Learn how to "gut-check" answers with data that are in dashboards. While many of the scavenger hunt questions require some SQL, some can be checked or answered entirely with processed data presented in our internal data visualization dashboards. In the introduction and answer key for the scavenger hunt, we provide links to the dashboards as well as the raw data sources.
-
Understand nuances in the data. Our data are very complex and the way the data get used often depends heavily on the use case, so the scavenger hunt is a great opportunity to bring attention to differences in tables and fields that need to be considered.
-
Ensure that all logistics of an onboarder's technical set-up worked. While a new employee would have gone to an earlier bootcamp session on setting up database connections, the data scavenger hunt ensures that onboarders issue queries against each of the core databases, so it should uncover any remaining permission issues prior to any mission-critical project work.
-
Become familiar with our Flatiron tool chain and documentation. QS team members typically work in R, SQL and/or Python, and we use tools like Git regularly. Onboarders are encouraged to use the scavenger hunt as an opportunity to check-in their code and practice using our core tools.
-
Learn how and where our core data are stored. We utilize a variety of PostgreSQL and MSSQL databases on different hosts, so the scavenger hunt is a great opportunity for onboarders to become familiar with syntax and platform differences.
-
Figure out who to go to for help when you get stuck on different problems. Our scavenger hunt lays out the experts in each area both within QS and outside of it, so that onboarders get to know key people, teams and Slack channels that are good resources for each content area.
To achieve these goals, our scavenger hunt has a short introduction with pointers to documentation on relevant data sources and dashboards. New hires are given guidance that they should spend about a half to a full day on the hunt, and they should aim to complete it within the first month. The scavenger hunt includes a series of questions including the following:
-
Find the number of patients in Flatiron's advanced non-small cell lung cancer cohort that have been tested for a gene mutation. How many patients had multiple successful tests? How many of these tests were next generation sequencing tests?
-
What percentage of nivolumab (an immunotherapy drug) that was ordered by physicians was prescribed in the context of a clinical study?
We are delighted to say that our scavenger hunt model has proven to be a big success! The newer QS team members (authors included) have found it to be fun and effective. Furthermore, Flatiron's engineering teams heard about our scavenger hunt and have even started using it for new engineers by adding in additional questions that are relevant to their own pipelines and data sources. In our next iteration, a group of the newest QS team members are working towards a fully self-service, scalable scavenger hunt that can be completed by any technical team member. As with all things at Flatiron, we will continue to expand it to other data sources and grow the scavenger hunt over time. Happy Hunting!


